Work · Case study · 02
RepoInsight
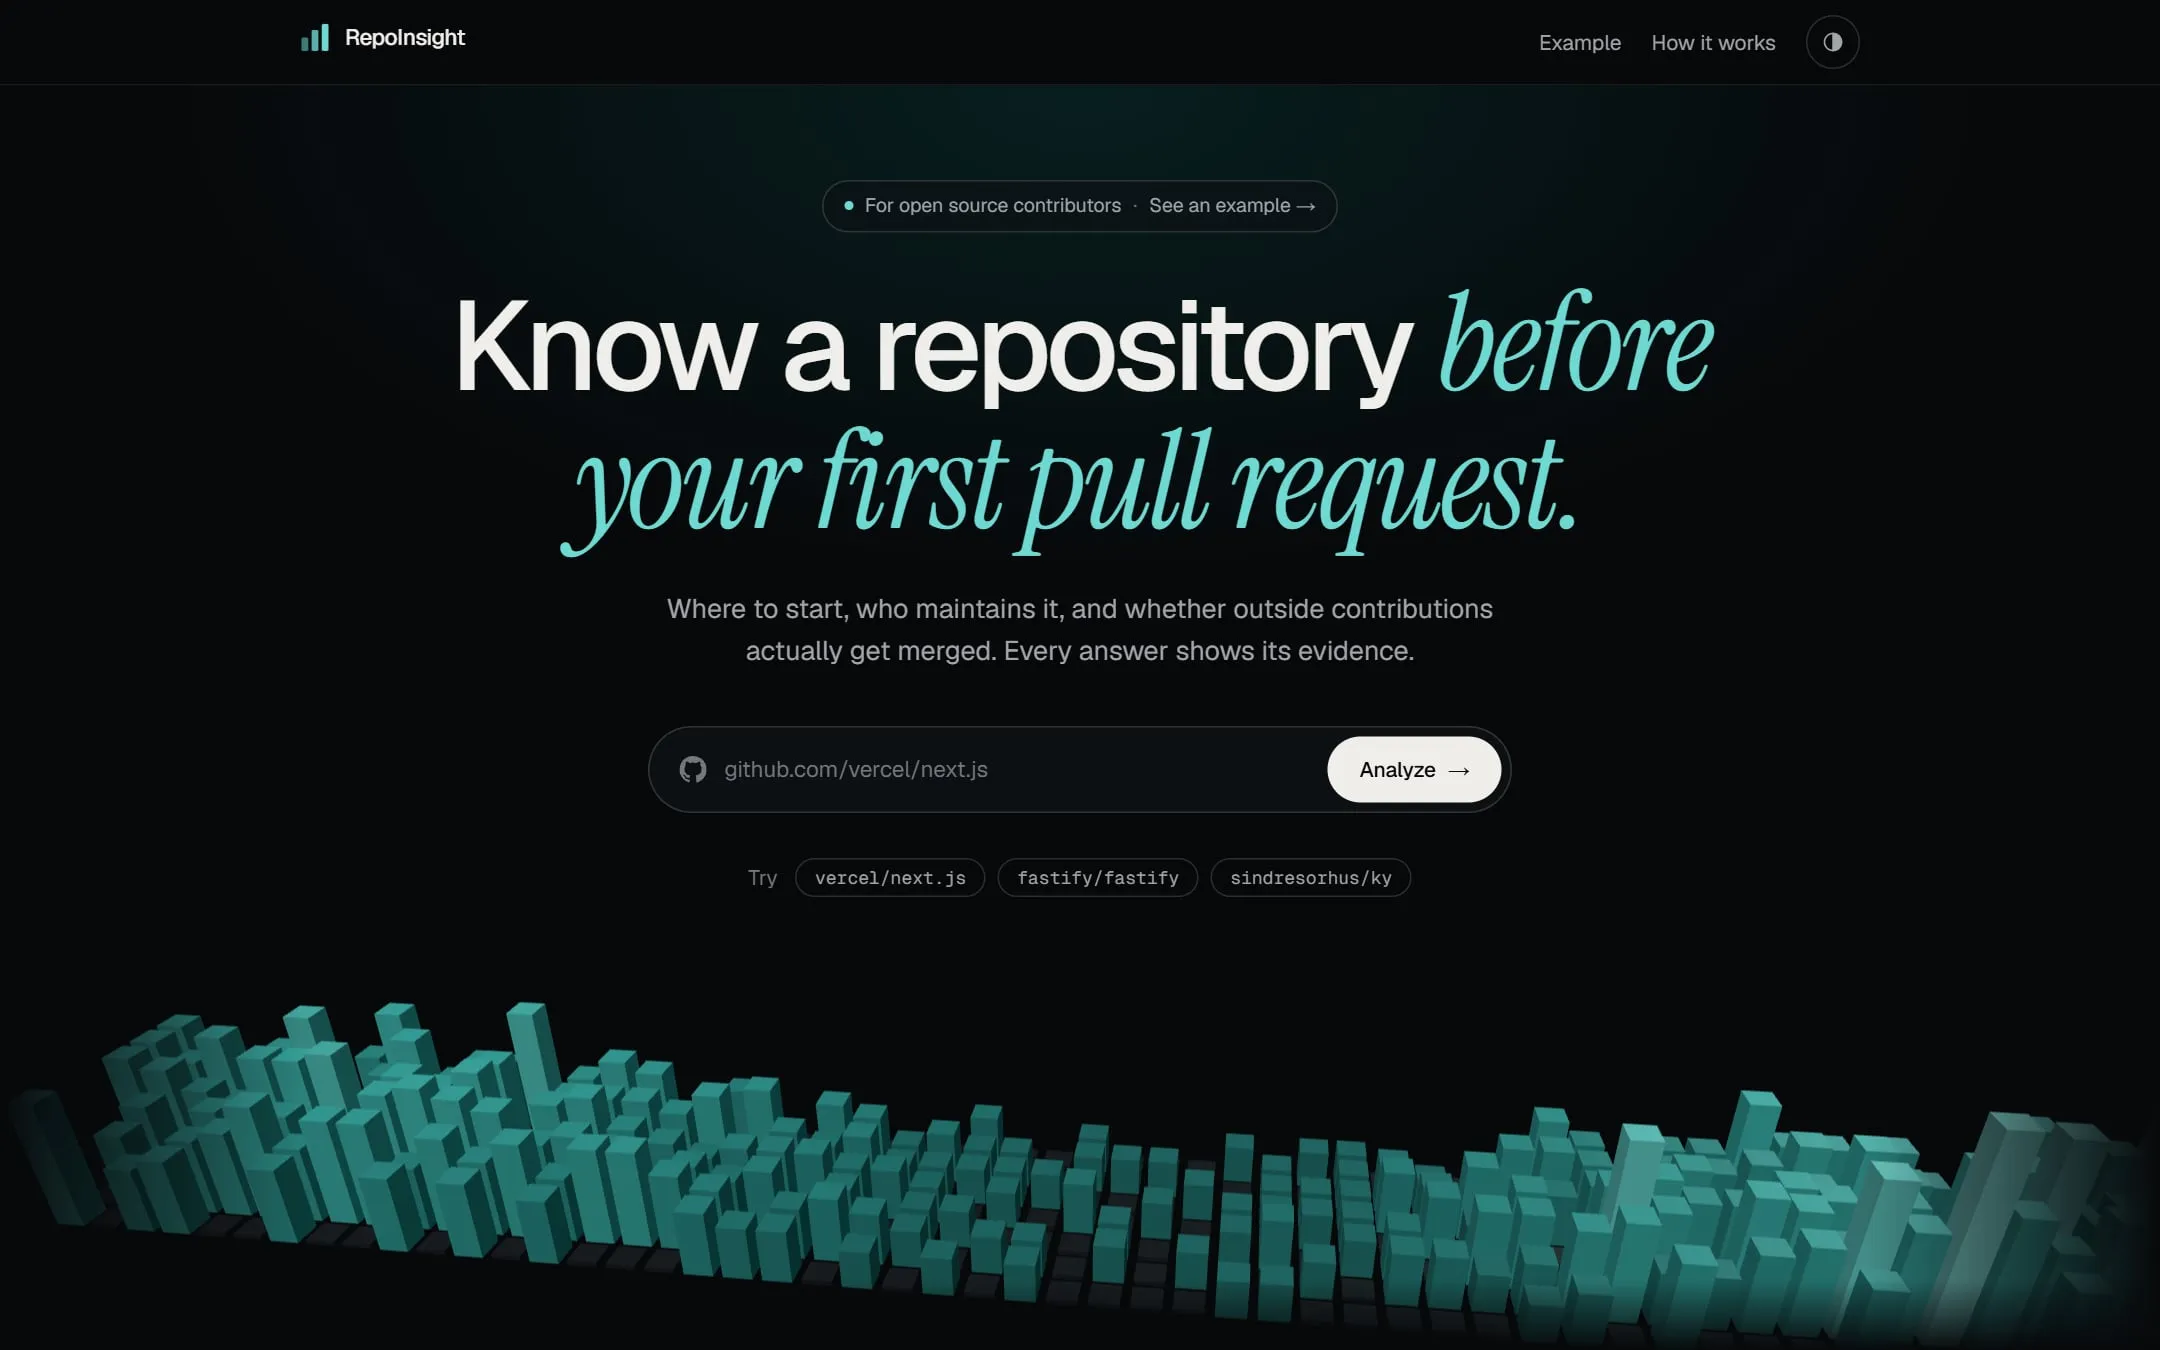
Know a repository before your first pull request. Paste a public GitHub repository and it reports where to start, who maintains it, how fast people reply, and whether outside pull requests actually get merged. Every answer is calculated by a fixed rule and shows its evidence; there is no AI and no health score.
Open the app ↗Example report ↗Repository ↗
Architecture
The system, at a glance.
01 — Claims and evidence
| Claim | Measurement | Context | Verify |
|---|---|---|---|
| Live, with no sign-in | repoinsight-app.vercel.app | paste any public GitHub repository; the visitor is never asked for an account or a token | open the app ↗ |
| Test suite | 74 tests | URL parsing, HTTP error mapping, pagination and coverage, and every analysis function including empty and truncated data; passing from a fresh clone on 2026-10-01 | src/lib ↗ |
| Contributor checklist | 10 questions | after GitHub’s Open Source Guide; each answered yes, no or unknown against a threshold printed in the report | checklist.ts ↗ |
| Data read per report | 11 GitHub REST endpoints | about 12 requests for a small repository, up to about 45 for a large one | README · data sources ↗ |
| Running cost | no database · no paid API · no AI | the only limit is GitHub’s free allowance: 60 requests an hour without a token, 5,000 with one | README · cost and scaling ↗ |
| Grounded in research | 4 cited sources | newcomer barriers, abandoned pull requests, time to first response, and GitHub’s Open Source Survey, each mapped to something the report measures | README · for contributors ↗ |
| Stack | TypeScript · Next.js 16 · React 19 · three.js | 39 commits; deployed on Vercel’s free tier | commit history ↗ |
02 — The problem
Before a first pull request, a contributor has to guess what a project is like. Is anyone replying? Do pull requests from outside the team get merged? Is there something small to start on? Finding out usually means clicking through commits, contributors, releases, issues and pull requests and forming an impression.
RepoInsight reads the same public data and answers those questions directly. It is deliberately not a chatbot, and it does not produce a health score. Every number is calculated by a fixed rule, and every answer can be opened to show what was observed, the formula, why it matters, and what it does not prove.
03 — How it works
From a pasted URL to an answer with its evidence
- A small client talks to the GitHub REST API: an auth header when a server token exists, error mapping, pagination headers. Fetchers call eleven endpoints, in parallel where they are independent, and normalise the responses into typed records that carry their own coverage: complete, or covered since a date.
- Analysis functions are pure. They take structured input plus an explicit “now”, with no React and no network, so the same dataset always produces the same numbers and every function can be tested on its own.
- A checklist of ten questions, taken from GitHub’s Open Source Guide, is answered from those numbers. Each has a stated threshold, and where the data cannot decide, the answer is “unknown” rather than a guess.
- A report runner orchestrates the requests, caches finished reports so a popular repository costs GitHub requests once, and emits progress events.
- The analyze endpoint streams those events to the browser as newline-delimited JSON, so the loading screen shows one line per real request group instead of a spinner.
- The report leads with the checklist, then starter issues, where outside pull requests ended up, the maintainers who reply, when they are usually around in the reader’s time zone, and a 3D skyline drawn from the repository’s real daily commit counts.
Calculated, not generated.
04 — Decisions
A count of checks, not a health score
The headline is the number of checks that pass, not a weighted score. A single number would hide which signal is missing; ten yes-or-no answers can each be opened and checked.
Fixed rules, nothing generated
Every metric is a formula over public data. That makes a report reproducible, testable, and free to run, and it means two people looking at the same repository see the same answer.
Evidence in four parts
Each metric separates what was observed, the calculation, why it matters, and its limitation, so a reader can tell a measurement from an interpretation.
A bot is not a reply
Research on pull requests finds that bots often post the first response. Time to first response therefore counts only another person’s comment, an inline review comment, or the merge.
A dash instead of a partial number
Lists carry coverage information. A window is reported only if the fetched data is known to be complete back to its start; otherwise the report shows a dash rather than a smaller, wrong total.
Three ways to stretch a free API
A server token raises the allowance from 60 to 5,000 requests an hour. Finished reports are shared between visitors. And if the server’s allowance runs out, the visitor’s own browser reads GitHub directly, so that path grows with the audience instead of being divided among it.
05 — What went wrong
Stated on purpose.
Busy repositories produced partial numbers
Very active repositories exceed the page limit, so a 30 or 90 day window was only partly fetched and its total came out too small. Lists now record whether they are complete and how far back they reach, and a window the data does not cover is not reported.
Answered pull requests looked unanswered
The first version read only conversation comments, so a pull request answered through inline review looked ignored. Inline review comments are now fetched too, and coverage is the shallower of the two lists. A review that only approves, without a comment, is still not seen.
Every visitor shared one rate limit
Without a token, all visitors drew on the same 60 requests an hour. The fix came in three parts: a server token, a shared cache of finished reports, and the fallback to the visitor’s own allowance.
The tests did not run on a fresh install
The lockfile was incomplete, so a clean install could not run the suite. It was regenerated, and the 74 tests pass from a fresh clone.
06 — Limitations
- Public data only. Private forks, internal trackers and chat are invisible.
- Very active repositories exceed the page limit; longer windows are then not reported.
- A review that only approves, without a comment, is not read, so some answered pull requests look unanswered.
- Only GitHub’s two default starter labels are checked. Projects with their own labels show no starter issues.
- Tone is not measured. Nothing here tells you whether a community is welcoming.
- Activity is not quality. Nothing here measures correctness, security or test coverage.
- The source is published so it can be read and evaluated; it is not open source.
07 — What I’d do next
- Exact window totals for very large repositories.
- Tag-based release detection when a project does not use GitHub Releases.
- Side-by-side comparison of two repositories.
- Shareable report snapshots.
Last verified 2026-10-01 · numbers reported as measured, with their context and source